
Preprocessing of -Omics Data
(Version: November 2021)
During the past years and decades, a large variety of high throughput (omics-) methods was developed to deepen the understanding of biological systems (e.g. organisms, diseases). All of these methods create large amounts of raw data that have to be preprocessed before analysing them. There are many things to consider for the choice of preprocessing steps and how they are conducted.
Planning of experiments
Before conducting an experiment, its design has to be carefully thought out, because it has great influence on the preprocessing. The measured variables of interest (e.g. the expression of certain genes under certain conditions) have to be defined as well as the additional measurements (e.g. the expression of all genes or of some so called housekeeping genes). This is necessary because the preprocessing always needs some constant values.
The number of samples and their distribution into the different experimental conditions also influences the preprocessing.
Planning an experiment should be done by experimentalists and bioinformaticians/data analysts together to be sure that all prerequisites are fulfilled for the preprocessing and the statistical analysis of the data.
Microarrays and 2D-Gels
Microarrays are often used for the analysis of differences in the mRNA amount of two different cells. Therefore, the mRNA is transcribed into cDNA, which is bound to immobilized DNA probes and detected by fluorescence.
An application which combines the preprocessing and analysis of a specific microarray dataset can be found HERE.
2D gels combine isoelectric focusing (IEF) and orthogonal sodium dodecylsulfate polyacrylamide gel electrophoresis (SDS-PAGE) for a high resolution separation of complex protein mixtures into single proteins. They are used for example to analyse differences in the protein amounts of different cells. Even though mass spectrometry based methods make up a large part of proteomics analyses nowadays, 2D gel electrophoresis still has advantages for special scientific questions [1].
Preprocessing and analysis of a 2D gel dataset as described below was applied by BioControl in the past [2] to gels with three colour channels, so called DIGE gels.
Image analysis
Characteristic feature of 2D gels and microarrays is the image based first preprocessing steps. With two or more samples, images of microarrays and gels have to be matched as good as possible to compare t same mRNAs or proteins between the samples. On microarrays, probe positions are fixed, which eases the matching a lot whereas the course of protein separation in 2D gels and thus the positions of protein spots differs a little in each run [3].
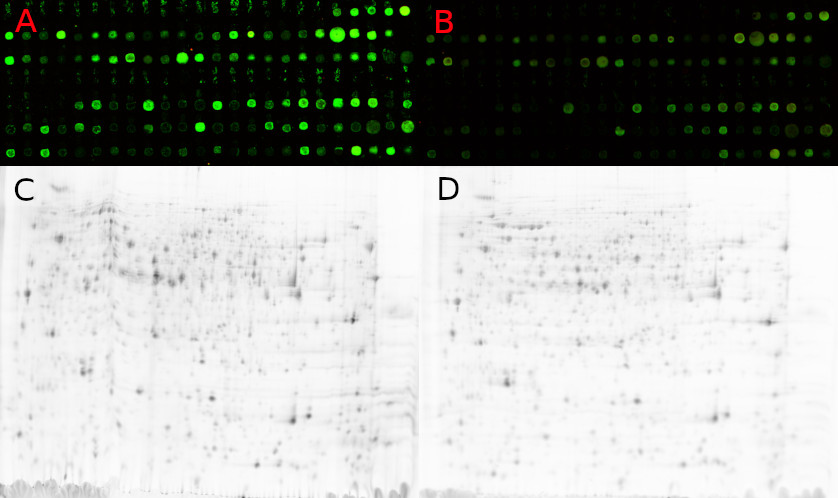
C,D – 2D gel scans oft two different samples, spot positions vary
(images with friendly permission of the HKI Jena).
Matching and spot detection is most often conducted by the software that comes with the scanner. It is important to choose the appropriate settings for background normalization, artefact reduction and, in 2D gels, separation of spot groups. This requires an (iterative) manual step to assist the automatic matching and avoid mistakes. The commercial software often is quite expensive, so some researchers try to get similar results using open source software [4].
Missing values
Problems during the matching of 2D gel images lead to missing values in the protein spot data. A protein spot is present on both images but it is not recognized properly (e.g. due to image distortion) and so there are intensity values missing for some conditions. In Addition, biological variability can cause missing values (in microarrays and 2D gels) when a gene or protein is regulated in such a way that it occurs in one sample (and is seen as spot there) but not in another one.
Missing values hamper the data analysis and the application of some methods (e.g. clustering or PCA), so they have to be dealt with. If they are biologically caused, meaning the gene or protein is not present (or below the detection threshold) at one condition, they can be replaced by some minimal value. This can be the lowest values of the experiment to which a variation can be added to reflect experimental variance. Are missing values caused by technical issues, a k-nearest-neighbour imputation has been approved for 2D gels [2].
Normalisation
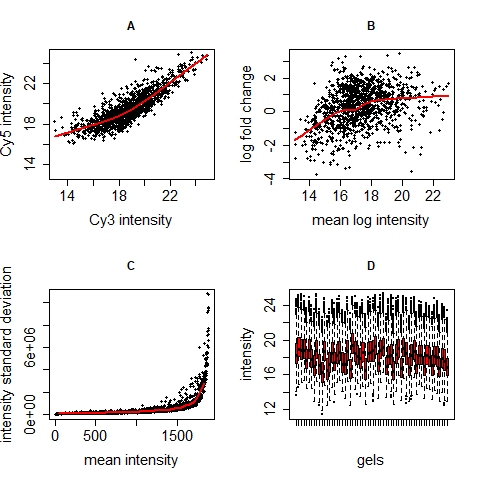
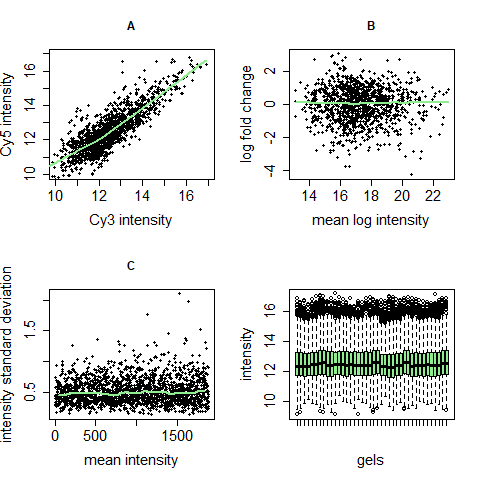
There are many possibilities for the normalisation of microarray and 2D gel data. Both techniques create spots and show similar technical errors so many normalisation algorithms can be used on both. Here, we show a possibility for normalisation that can repair four problems occurring in microarray and 2D gel data [5]. Two normalisation steps are carried out successively: centering and variance stabilization.
Fundamental hypothesis of these normalisation techniques is that only few genes or proteins change their expression or regulation in the experiment but the majority of them will be stable. This is valid when analysing a whole genome or proteome of a cell. When analysing only part of it, this assumption can be violated. Then, another stable variable is needed, e.g. the protein amount of the sample.
Centering and variance stabilization can solve four problems occurring in microarray and 2D gel data:
- Dye effects: different dyes bind differently to genes/proteins, so one channel can be brighter than the other, sometimes only in one intensity range.
- Dependency of differential regulation from mean intensity: genes/proteins with low intensities are not per se regulated more or less than those with high intensities. This often is a problem especially in regions of low intensity.
- Dependency of intensity variation from intensity mean: genes/proteins with higher intensities often show a higher variability than those with lower intensities although there is no biological explanation for this.
- Difference of intensity variance across different gels: When assuming that most proteins of an experiment are not differentially regulated, the intensities of different gels should be similarly distributed. This is often not the case in raw data.
Next-Generation-Sequencing(NGS) and Mass Spectromety(MS) data
NGS largely replaced microarrays in many applications such as the gene expression analysis of whole genomes because it is faster, cheaper and more exact. Similar reasons led to the replacement of 2D gels by mass spectrometry based methods.
Missing values
NGS datasets do not contain missing values but they do have 0 values when no fragment for a gene was measured or assigned. There are different possibilities to handle those values depending on their number. When only two of three replicates show a value larger than 0, most often these two are enough. If only one non-zero value is present, a second one can be imputed using the first one and the local variance of the dataset. Three 0 values would be imputed using the lowest measured value and the local data variance.
MS data often show a lot of 0 values, especially when only parts of a proteome or metabolome are analysed. When there are only few such values, they can be imputed by a minimal value similarly to the above described procedure for NGS data. When there are more 0 values, it can be necessary to exclude certain proteins or whole samples from the analysis. These proteins could be analysed later on with a targeted approach by investigating their spectral range in more detail.
Normalisation
NGS data have to be normalised according to sequencing depth and gene length to compensate the different number of reads per region of the genome. Using RPKM, TPM or MRN, data are centered, analogous to microarray data. Most often there is no need for variance stabilization as second step; this can be part of the customized (error-) model. However, it cannot be skipped because NGS experiments show a much higher variance in the low intensity range than in the high one.
MS data have to be normalised, too, to eliminate fluctuations in the technical setup of the experiments. Here, it is very important to know, whether you analyse a whole cell proteome or only small parts of it like the secretome or a certain group of metabolites. In these cases, the whole proteome cannot be the base of normalisation since it is not measured. Maybe, the sample volume could be used instead. If not, it can be the case that normalisation is not possible at all and raw data have to be used for the analysis. This again points to the fact that experimentalists and bioinformaticians should be working together even before the experiment to acquire raw data of high quality for the statistical analysis.
References
- [1] K. Marcus, C. Lelong, T. Rabilloud: What room for two-dimensional gel-based proteomics in a shotgun proteomics world? In: Proteomes, 8(3):17, 2020. doi: 10.3390/proteomes8030017
- [2] D. Albrecht, R. Guthke, A. A. Brakhage, O. Kniemeyer: Integrative analysis of the heat shock response in Aspergillus fumigatus. In: BMC Genomics, 11:32, 2010. doi: 10.1186/1471-2164-11-32
- [3] D. Albrecht, O. Kniemeyer, A. A. Brakhage, R. Guthke: Missing values in gel-based proteomics. In: Proteomics, 10(6):1202–1211, 2010. doi: 10.1002/pmic.200800576
- [4] J. A. Molina-Mora, D. Chinchilla-Montero, C. Castro-Peña, F. García: Two-dimensional gel electrophoresis (2D-GE) image analysis based on CellProfiler: Pseudomonas aeruginosa AG1 as model. In: Medicine, 99(49):e23373, 2020. doi: 10.1097/MD.0000000000023373
- [5] D. Albrecht, O. Kniemeyer, A. A. Brakhage, R. Guthke: Normalisation of 2D DIGE data - On the way to a standard operating procedure. In: BIRD08, Schriftenreihe Informatik, 26:55–64, 2008.