
Data management
(Web user interface and database
of a biological research consortium)
(Version: July 2017)
Background
More and more biological and medical applications and experiments generate large amounts of data. These are processed by further analyses (e.g. as conducted by BioControl Jena: Omics Analysis). After the experiment and the analysis it is preferable (and very often also mandatory) to keep not only the data but also all relevant meta data to ensure continuous availability. Furthermore, in large research consortia the data might be collected decentrally, yet there must be a central location where at least the meta data can be retrieved by all members dependent on certain access rights. In the following, such a combination of database (back end) and web-based access (front end) will be described exemplary. This web user interface and database featured by BioControl Jena is in daily use by a biological research consortium.
Back end
Data Collection
Microsoft Excel® is a common tool for the collection and management of (tabular) data that can be further adapted to meet certain needs by the underlying language VBA. Therefore, Excel® templates were created that can collect meta data from RNA-seq, microarray and LC-MS/MS experiments. Those templates are completed by the experimentalists in conjunction with the bioinformatician responsible for data analysis. In a subsequent automatic step the data are parsed into the database.
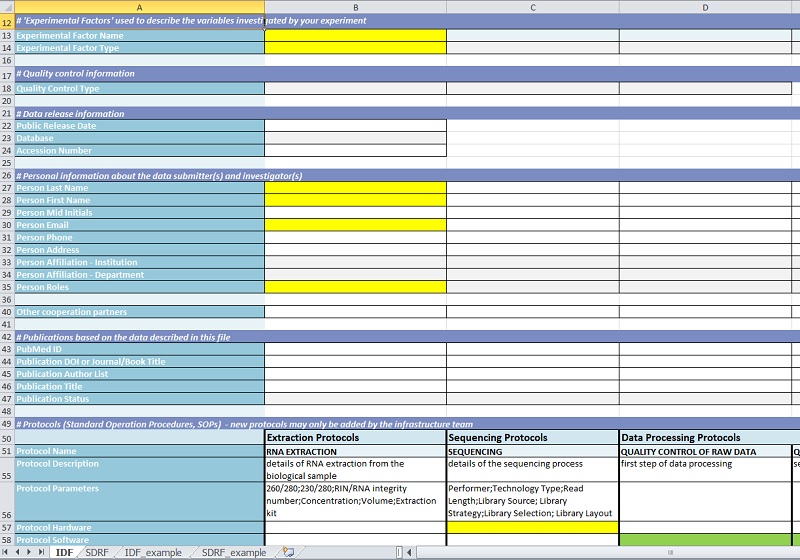
The first sheet of each file contains general data specific for the experimental setup, like experiment title and description, experimental parameters (factors) or participating personnel:
In a second sheet the information about individual biological samples is collected (e.g. species and strain, specific experimental conditions, parameters of data analysis). Dependent on the kind of experiment this might become quite extensive. Therefore, information common to all samples can be copied by a one-click macro into all relevant cells, while sample-specific information is included separately. Most of the inputs are implemented as drop-down selections to sustain controlled vocabulary. For achieving comparability to other public databases this controlled vocabulary is based on the MGED ontology and the PSI MS ontology. Amongst the meta data collected in the templates there is also the information where the actual experimental data is stored.
Data storage
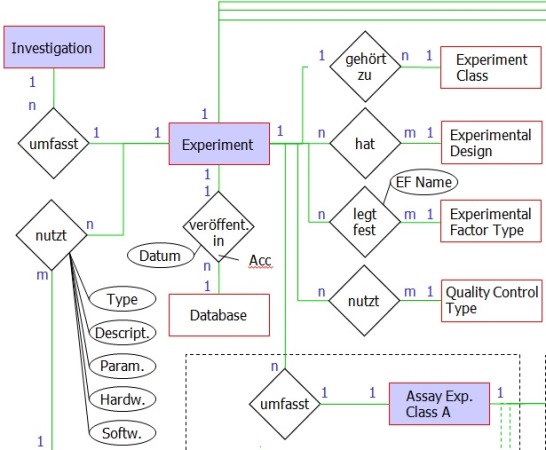
Object-relational databases are nowadays' standard for the effective (esp. concerning memory and access time) storage of large amounts of data. Due to positive experiences in the past and the applicability for the present case PostgreSQL was chosen for the data management system. For satisfying the data diversity and sustaining maximal extensibility the data structure must be considered carefully in advance to the generation of the database (see partial entity-relationship diagram). The chosen data structure is considering both the data collection templates and an optimal storage of meta data from high-throughput experiments:
Front end
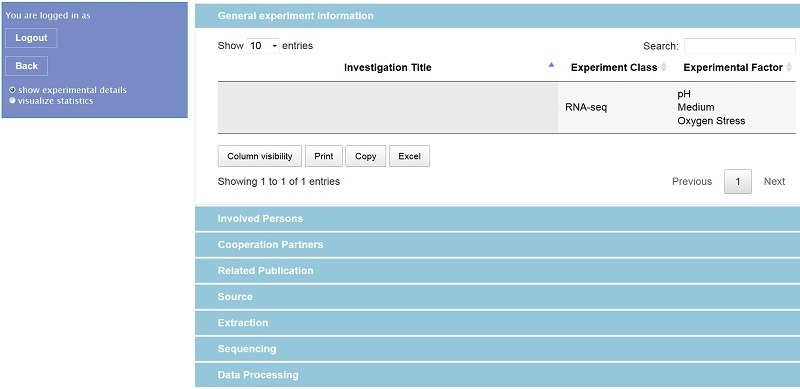
For accessing the database a web-based solution is adequate because several institutions are generating data and there should be access from different locations. The access procedure itself was implemented in PHP while for the visualization of the web user interface a combination of HTML, CSS and JavaScript was applied. Dependent on individual access rights a user might now retrieve all relevant meta data of an experiment (for privacy reasons login name and experiment title are removed from the figure):
Similar to the templates the respective experimental raw data are only linked to, hence the responsible experimentalist must be contacted for an actual data exchange. However, selected data analysis results (e.g. gene or protein lists) of one experiment can be shown in the web interface by tables or figures:
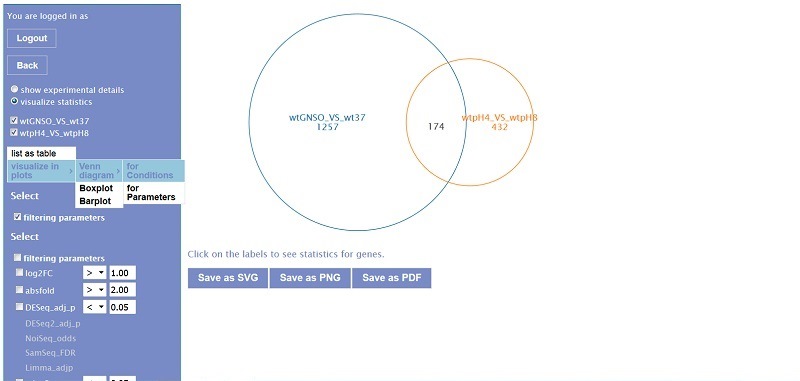
The tables and plots can be adjusted by filter and visualization parameters. For example different thresholds for fold changes or p-values can be tested or different conditions as well as software settings can be compared. Furthermore, the gene lists are linked to external databases. This way the maximum available information is provided for each experiment.
This short description of an actual application example is showing only a small part of possibilities and options that can be adjusted due to the customers needs (for example the shown application will be extended by a front end upload mask and interfaces to further external tools for genome visualization and network analysis).