
Whether you generate large-scale data from transcriptomics, secretomics or other omics disciplines – we support you in downstream data analysis with strong biological and technical expertise. Using tailored algorithms, we turn your raw data into results that are easy to interpret and visually compelling. Below, we illustrate this in practice with a concrete transcriptome analysis example investigating the immune response to infections.
(Status: April 2016)
Biological question
The biological questions behind an omics analysis typically concern selected processes and their underlying mechanisms. In general, the focus is on how biochemical components respond to different conditions (e.g. mutation, environmental conditions, pathogens).
The example below analyses real transcriptome data obtained with Illumina microarrays (“Illumina HumanHT‑12 V4.0 expression beadchip”) that are publicly available.[1]
The study investigates the response of the immune system – represented by peripheral blood mononuclear cells (PBMCs) – to several conditions, with a particular focus on infection with Candida albicans. Among other aspects, the type I interferon pathway plays a central role.[1] The dataset includes replicates of non‑infected blood (30+35) and infections or stimulations with Borrelia (31+36), Candida (24+34), LPS (26+24) and tuberculosis (23+36) at 4 h and 24 h. Rather than reproducing all results of the original paper (especially the comparison of healthy and patient donors), we show a selection of our own analysis results.
Methods and results
The analysis workflow comprises platform‑specific preprocessing, statistical testing for differential transcript changes and enrichment analysis to detect significantly over‑represented categories. Network inference, see.[2][3] and additional results from the original publication are not discussed here.
Data preprocessing
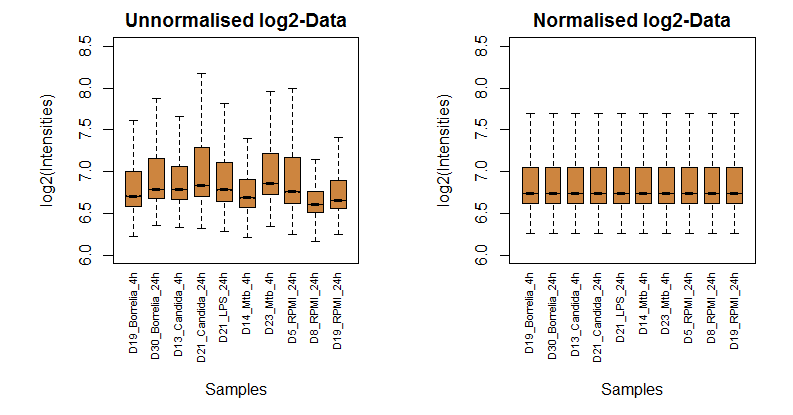
The first step performs platform‑specific preprocessing. It depends on the experiment type, the measurement platform (for microarrays, e.g. Affymetrix or Illumina) and the associated data and error models. In this example, we assume that each sample (each array‑level transcriptome) should share a similar distribution of intensities (quantiles), and we apply quantile normalisation accordingly.[4]
Only after this normalisation step can significantly changed components be identified. The following two figures compare the distributions of 10 randomly selected samples before and after normalisation:
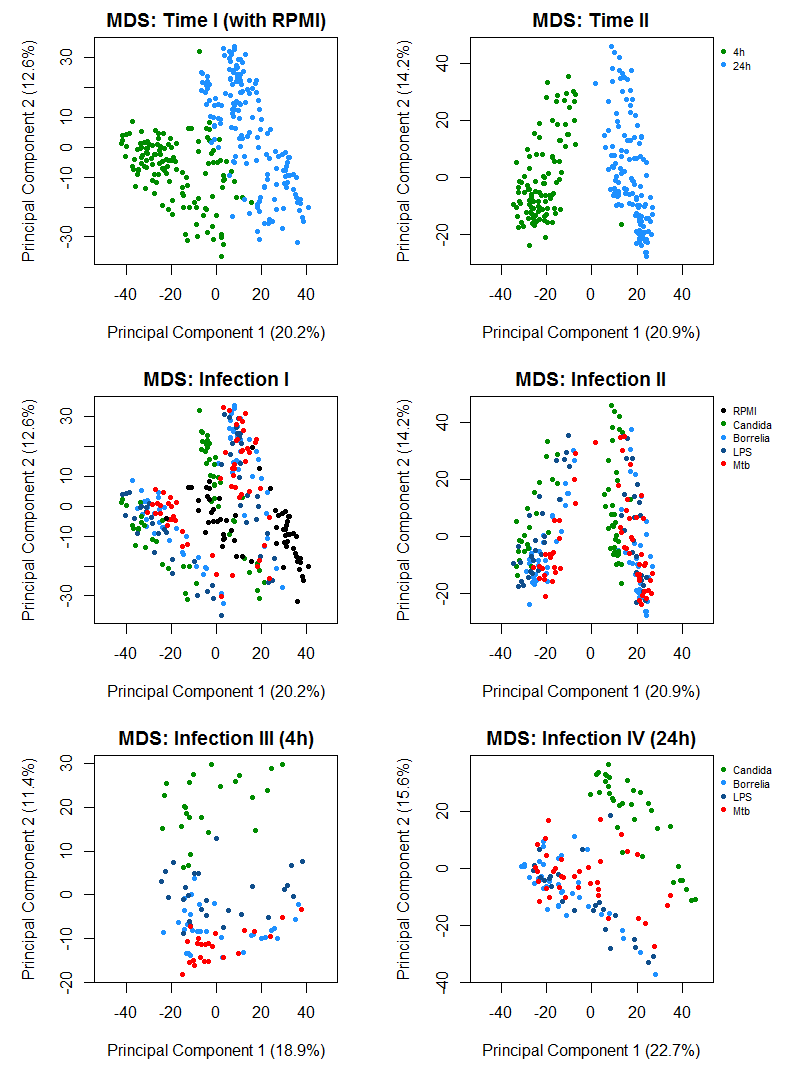
As a first assessment of similarities between samples and pre‑defined groups, we visualise the first two principal components of the normalised data using multi‑dimensional scaling (MDS).[5] In the plots (coloured by time point or infection, with and without control) one can see: (1) the clearest separation is by time point, (2) donors themselves exert a strong influence, and (3) Candida separates best from the other three conditions.
Statistical tests (differential expression and specific responses)
Statistical tests are then used to identify significantly altered components compared with controls. The results form the basis for analysing these components (names, counts, effect sizes) and for downstream enrichment and functional annotation.
Normalised and log‑transformed data serve as input for the tests. Using the available replicates and under specific model assumptions (here: linear model, normally distributed error), the various conditions are compared. In this example, each infection condition is compared to its corresponding time‑matched control (4 h and 24 h), since the control itself shows time‑dependent changes (as visible in the MDS plots).
We apply the TREAT method,[6] as implemented in the R “limma” package,[8] using thresholds for fold change (here: 1.1) and adjusted p‑value (here: 0.05, FDR according to Benjamini–Hochberg).[7] The following outputs are shown: heatmaps, Venn‑type summaries and result tables.
We start with the top differentially expressed genes after Candida infection:
| ProbeID | EntrezID | SymbolID | fc | padj |
|---|---|---|---|---|
| ILMN_2218856 | 414062 | CCL3L3 | 48.79 | 1.51E-55 |
| ILMN_2207291 | 3458 | IFNG | 44.71 | 1.27E-64 |
| ILMN_1728106 | 7124 | TNF | 44.45 | 1.16E-66 |
| ILMN_1747355 | 414062 | CCL3L3 | 42.47 | 1.41E-50 |
| ILMN_1671509 | 6348 | CCL3 | 41.25 | 1.52E-48 |
| ... | ... | ... | ... | ... |
| ILMN_2197365 | 5997 | RGS2 | -3.25 | 5.80E-25 |
| ILMN_1774761 | 729230 | CCR2 | -3.60 | 1.01E-14 |
| ILMN_1663866 | 7045 | TGFBI | -3.75 | 1.41E-07 |
| ILMN_1686623 | 1436 | CSF1R | -3.94 | 6.55E-12 |
| ILMN_1687301 | 1462 | VCAN | -4.57 | 6.01E-11 |
Next, we determine which genes are specifically expressed in each condition. Two complementary representations are used: a classical Venn diagram based on genes significantly changed versus control and a matrix‑like representation that remains readable even for many conditions by indicating which genes differ between all condition pairs.
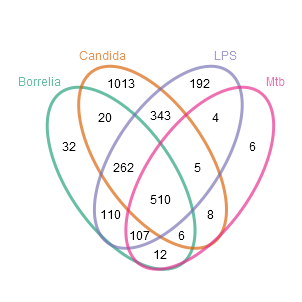
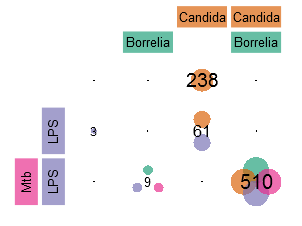
These views show that Candida infection yields many condition‑specific genes compared with the other stimuli, but also that a large set of genes (510) is differentially expressed across all conditions. Based on the second representation, data can be visualised as a heatmap with dendrograms to identify gene clusters with shared patterns (download here). This again highlights that many genes are uniquely up‑regulated in Candida infection (e.g. CCL8, CXCL10, TNFSF13B), while others such as CCL3L3, TNF, CCL3 or CCL3L1 contribute to a shared response.
The numerical values behind these patterns are also of interest. The tables below summarise the general and Candida‑specific responses of the 10 most strongly differentially expressed genes (with respect to Candida, up‑ and down‑regulated):
| ProbeID | EntrezID | SymbolID | fc_Borrelia_4h | fc_Candida_4h | fc_LPS_4h | fc_Mtb_4h | padj_Borrelia_4h | padj_Candida_4h | padj_LPS_4h | padj_Mtb_4h |
|---|---|---|---|---|---|---|---|---|---|---|
| ILMN_2218856 | 414062 | CCL3L3 | 18.91 | 48.79 | 36.07 | 15.65 | 1.57E-40 | 1.51E-55 | 5.80E-51 | 4.28E-32 |
| ILMN_1728106 | 7124 | TNF | 6.15 | 44.45 | 6.51 | 4.26 | 2.87E-24 | 1.16E-66 | 5.38E-24 | 9.02E-14 |
| ILMN_1747355 | 414062 | CCL3L3 | 20.75 | 42.47 | 35.94 | 18.07 | 2.30E-40 | 1.41E-50 | 1.86E-48 | 6.09E-33 |
| ILMN_1671509 | 6348 | CCL3 | 23.14 | 41.25 | 37.34 | 20.40 | 4.71E-41 | 1.52E-48 | 1.01E-47 | 5.97E-34 |
| ILMN_1773245 | 6349 | CCL3L1 | 12.05 | 40.45 | 28.13 | 10.95 | 7.12E-24 | 2.57E-41 | 3.59E-36 | 3.09E-19 |
| ... | ... | ... | ... | ... | ... | ... | ... | ... | ... | ... |
| ILMN_1769895 | 729230 | CCR2 | -2.90 | -3.25 | -3.05 | -2.48 | 1.85E-12 | 5.11E-14 | 7.84E-13 | 1.33E-07 |
| ILMN_2197365 | 5997 | RGS2 | -2.32 | -3.25 | -2.77 | -2.36 | 2.10E-14 | 5.80E-25 | 1.29E-19 | 9.48E-13 |
| ILMN_1774761 | 729230 | CCR2 | -3.06 | -3.60 | -3.27 | -2.55 | 2.67E-12 | 1.01E-14 | 6.68E-13 | 3.20E-07 |
| ILMN_1663866 | 7045 | TGFBI | -4.77 | -3.75 | -7.67 | -3.13 | 2.34E-11 | 1.41E-07 | 1.57E-17 | 5.14E-05 |
| ILMN_1686623 | 1436 | CSF1R | -4.67 | -3.94 | -7.38 | -3.13 | 3.12E-16 | 6.55E-12 | 3.65E-24 | 1.54E-07 |
| ProbeID | EntrezID | SymbolID | fc_Borrelia_4h | fc_Candida_4h | fc_LPS_4h | fc_Mtb_4h | padj_Borrelia_4h | padj_Candida_4h | padj_LPS_4h | padj_Mtb_4h |
|---|---|---|---|---|---|---|---|---|---|---|
| ILMN_1772964 | 6355 | CCL8 | 1.98 | 27.48 | 1.62 | 1.76 | 4.52E-01 | 3.85E-23 | 1.00E+00 | 1.00E+00 |
| ILMN_1791759 | 3627 | CXCL10 | -1.11 | 14.24 | -1.25 | -1.18 | 1.00E+00 | 2.31E-19 | 1.00E+00 | 1.00E+00 |
| ILMN_1801307 | 8743 | TNFSF10 | 1.01 | 5.64 | 1.33 | -1.40 | 1.00E+00 | 1.01E-33 | 7.92E-01 | 7.82E-01 |
| ILMN_2148785 | 2633 | GBP1 | 1.36 | 5.06 | 1.72 | 1.20 | 1.00E+00 | 1.56E-13 | 1.76E-01 | 1.00E+00 |
| ILMN_1701114 | 2633 | GBP1 | 1.31 | 4.28 | 1.53 | 1.01 | 1.00E+00 | 6.70E-12 | 5.94E-01 | 1.00E+00 |
| ... | ... | ... | ... | ... | ... | ... | ... | ... | ... | ... |
| ILMN_1728236 | 55106 | SLFN12 | -1.06 | 1.20 | -1.04 | -1.05 | 1.00E+00 | 4.92E-02 | 1.00E+00 | 1.00E+00 |
| ILMN_1684634 | NA | RP3-365I19.1-001 | -1.06 | 1.20 | -1.02 | -1.02 | 1.00E+00 | 9.40E-03 | 1.00E+00 | 1.00E+00 |
| ILMN_2088990 | 80231 | CXorf21 | -1.02 | 1.19 | -1.00 | -1.03 | 1.00E+00 | 8.59E-03 | 1.00E+00 | 1.00E+00 |
| ILMN_1712035 | 11070 | TMEM115 | 1.01 | -1.26 | 1.01 | 1.05 | 1.00E+00 | 4.91E-03 | 1.00E+00 | 1.00E+00 |
| ILMN_1699253 | 7417 | VDAC2 | 1.01 | -1.27 | -1.02 | 1.01 | 1.00E+00 | 6.10E-04 | 1.00E+00 | 1.00E+00 |
Enrichment analysis (functional annotation)
Finally, groups of genes are analysed for over‑representation of particular functions. Based on current annotation resources, this reveals functional responses for potentially novel conditions. Enrichment analysis[9] can be divided into (at least) two classes with respect to the test objective: (1) distribution‑based tests and (2) frequency‑based tests. For the latter, various methods (chi‑squared, hypergeometric, Fisher’s exact test) are applied to 2×2 contingency tables.
Enrichment always relies on annotation databases that define groups or categories. The most commonly used categories are Gene Ontology (GO) terms and KEGG pathways. Note that GO is a directed acyclic graph in which child terms are contained in their ancestors but not vice versa, so this dependency must be considered, e.g. as in GOstats.[10]
The figures below show, for gene lists derived from Candida‑induced differential expression and from the general response, selected top categories from GO and KEGG (for KEGG, the FungiFun2 platform was used).[11]
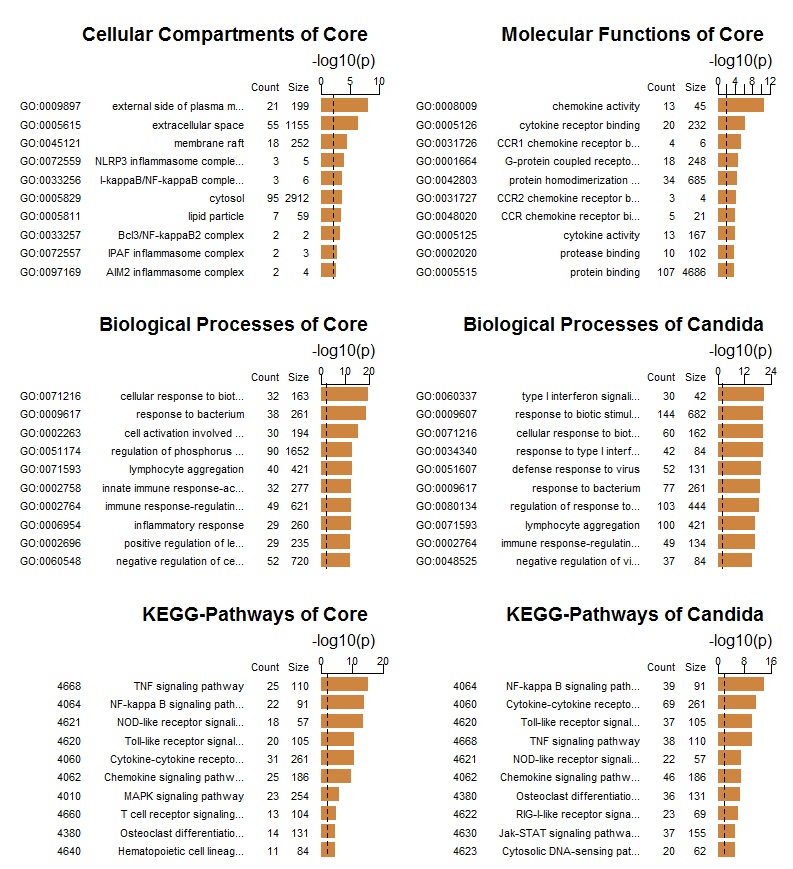
The GO categories for cellular components and molecular functions largely confirm expectations. For biological processes after Candida infection, the most important result – in line with the original publication – is the type I interferon‑related category, highlighting the central role of this pathway in anti‑Candida defence.[1] The KEGG comparison clearly shows distinct signalling pathways for the general response versus the Candida‑specific response. Further interpretation should be performed together with experts in biology and medicine.
(Full analysis results are available from BioControl on request.)
References
- [1] S. P. Smeekens et al.: Functional genomics identifies type I interferon pathway as central for host defense against Candida albicans. In: Nat Commun, 4:1342, 2013. doi: 10.1038/ncomms2343
- [2] J. Linde, S. Schulze, S. G. Henkel and R. Guthke: Data- and knowledge-based modeling of gene regulatory networks: an update. In: EXCLI Journal, 14:346–378, 2015. doi: 10.17179/excli2015-168
- [3] M. Weber et al.: Inference of dynamical gene-regulatory networks based on time-resolved multi-stimuli multi-experiment data applying NetGenerator V2.0. In: BMC Syst Biol, 7:1, 2013. doi: 10.1186/1752-0509-7-1
- [4] B. M. Bolstad, R. A. Irizarry, M. Astrand and T. P. Speed: A comparison of normalization methods for high density oligonucleotide array data based on variance and bias. In: Bioinformatics, 19(2):185–193, 2003. doi: 10.1093/bioinformatics/19.2.185
- [5] W. S. Torgerson: Theory and methods of scaling. New York: J. Wiley, 1958. ISBN: 978-0471879459
- [6] D. J. McCarthy and G. K. Smyth: Testing significance relative to a fold-change threshold is a TREAT. In: Bioinformatics, 25(6):765–771, 2009. doi: 10.1093/bioinformatics/btp053
- [7] Y. Benjamini and Y. Hochberg: Controlling the False Discovery Rate: a practical and powerful approach to multiple testing. In: J. R. Stat. Soc. Ser. B, 57(1):289–300, 1995.
- [8] M. E. Ritchie et al.: limma powers differential expression analyses for RNA-sequencing and microarray studies. In: Nucleic Acids Research, 43(7):e47, 2015. doi: 10.1093/nar/gkv007
- [9] D. W. Huang, B. T. Sherman and R. A. Lempicki: Bioinformatics enrichment tools: paths toward the comprehensive functional analysis of large gene lists. In: Nucleic Acids Research, 37(1):1–13, 2009. doi: 10.1093/nar/gkn923
- [10] S. Falcon and R. Gentleman: Using GOstats to test gene lists for GO term association. In: Bioinformatics, 23(2):257–258, 2007. doi: 10.1093/bioinformatics/btl567
- [11] S. Priebe, C. Kreisel, F. Horn, R. Guthke and J. Linde: FungiFun2: a comprehensive online resource for systematic analysis of gene lists from fungal species. In: Bioinformatics, 31(3):445–446, 2015. doi: 10.1093/bioinformatics/btu627