
With our specialised systems biology-based metabolic modelling and simulation, we make the complex intracellular regulatory mechanisms of your production strains transparent and controllable. Using central metabolic processes – such as the respiratory adaptation of the electron transport chain to changing oxygen conditions – we decipher the exact interplay of enzyme activities, metabolites and transcription factors. Through mathematically sound kinetic submodels and state-of-the-art iterative parameter identification, we transform heterogeneous biological data into a simulation-ready digital twin. This provides a robust decision basis to understand microbial adaptation mechanisms, unravel functional feedback loops and significantly shorten your biotechnological development cycles without costly laboratory campaigns.
(Status: June 2016)
Application example
In the reactions of the electron transport chain (ETC, also: respiratory chain), electrons from central metabolism are transferred to electron acceptors while simultaneously creating a proton potential, which is ultimately used to generate the biochemical energy carrier ATP. The reactions of the ETC are regulated in order to adapt to different conditions. With the help of a kinetic model, Henkel et al. investigated how the bacterium Escherichia coli adapts to different oxygen conditions.[1]
Only steady-state operating points in a chemostat (continuous cultivation) were considered, under different oxygen conditions.[2][3] For biological and experimental background, please also refer to.[4–6] The available measurements show characteristic behaviour in specific components (both metabolite concentrations and a transcription factor activity), which form the starting point for kinetic modelling. In the following, a strongly simplified submodel of the regulated ETC is derived (based on artificial data; JavaScript must be enabled to display formulas), while the full description is given in the cited publication. The aim is to identify which regulatory structures can explain the data and whether ubiquinone is the main inhibiting factor for ArcA.
Modelling
Modelling starts from the following schematic, which reflects the relatively well-established structural information on ETC reactions and the existence of the two transcription factors FNR and ArcA, whose regulatory roles are analysed in the model (other available information is less reliable or contradictory, or does not adequately explain the data):
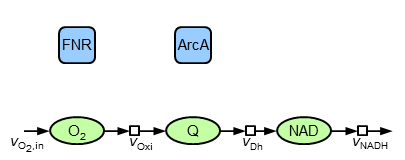
(Not all assumptions are detailed here.) Oxygen is taken up and consumed in oxidase-type reactions. In the process, ubiquinol (QH\(_2\)) is oxidised to ubiquinone (Q). This redox pair – like NADH/NAD – also participates in dehydrogenase reactions. The available electrons of central metabolism are represented by NADH, with the model constructed from the oxidised species, which requires an outflow of NAD as an interface to central carbohydrate metabolism. The corresponding differential equations are:
\[ \dot{c}_{\mathrm{O_2}} = v_{\mathrm{O_2,in}} - v_{\mathrm{Oxi}} \] \[ \dot{c}_{\mathrm{Q}} = v_{\mathrm{Oxi}} - v_{\mathrm{Dh}} \] \[ \dot{c}_{\mathrm{NAD}} = v_{\mathrm{Dh}} - v_{\mathrm{NADH}} \]It is assumed that (i) the reactions are quasi-irreversible, (ii) reactions of isoenzymes can be lumped, hence we refer simply to “the” oxidase and “the” dehydrogenase, and (iii) the total amounts of oxidised and reduced species are constant, i.e. Q + QH\(_2\) = const. and NAD + NADH = const. For the rate equations, physiologically plausible kinetics are used:
\[ v_{\mathrm{O_2,in}} = \frac{v_{\mathrm{O_2,in,100\%}} \times t}{t_{\mathrm{end}}} \] \[ v_{\mathrm{Oxi}} = a_{\mathrm{Oxi}} \frac{c_{\mathrm{O_2}}}{K_{\mathrm{m,Oxi,O_2}} + c_{\mathrm{O_2}}} \frac{c_{\mathrm{QH_2}}}{K_{\mathrm{m,Oxi,O_2}} + c_{\mathrm{QH_2}}} \] \[ v_{\mathrm{Dh}} = a_{\mathrm{Dh}} \frac{c_{\mathrm{Q}}}{K_{\mathrm{m,Dh,Q}} + c_{\mathrm{Q}}} \frac{c_{\mathrm{NADH}}}{K_{\mathrm{m,Dh,NADH}} + c_{\mathrm{NADH}}} \] \[ v_{\mathrm{NADH}} = v_{\mathrm{max,NADH}} \frac{c_{\mathrm{NAD}}/c_{\mathrm{NADH}}}{K_{\mathrm{m,NAD}} + c_{\mathrm{NAD}}/c_{\mathrm{NADH}}} \]For oxidase and dehydrogenase, enzyme activities are equated with maximum rates. The oxygen inflow \(v_{\mathrm{O_2,in}}\) is slowly varied so that the resulting simulations can be compared with steady-state measurements. The question now is how the following data on oxygen, ubiquinone and ArcA, for different oxygen conditions (anaerobic … microaerobic … aerobic, represented by the percentage of “aerobiosis” \(a\)), can be explained:
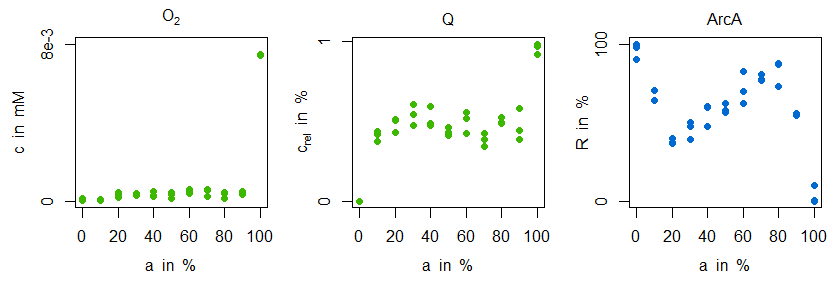
In essence, both oxygen and ubiquinone show an almost constant behaviour in the microaerobic range (with strong increases around 100% aerobiosis), whereas ArcA shows a characteristic “zigzag” pattern. For sensitive regulation (“stabilisation”, “homeostasis”) of oxygen, the following regulatory substructure is introduced (due to two inhibitions, this is a positive regulation structure, but with respect to oxygen, via the oxidase reaction, it forms a negative feedback loop):
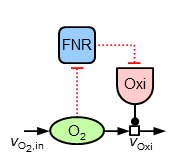
To capture the observed sensitive regulation, the following equations are added:
\[ R_{\mathrm{FNR}} = \frac{c_{\mathrm{O_2}}^{n_{\mathrm{FNR}}}} {K_{\mathrm{A,FNR,O_2}}^{n_{\mathrm{FNR}}} + c_{\mathrm{O_2}}^{n_{\mathrm{FNR}}}} \] \[ v_{\mathrm{syn,Oxi}} = p_{\mathrm{syn,Oxi,min}} + p_{\mathrm{syn,Oxi,FNR}} \times (1 - R_{\mathrm{FNR}}) \] \[ \dot{a}_{\mathrm{Oxi}} = v_{\mathrm{syn,Oxi}} - D \times a_{\mathrm{Oxi}} \]The last equation introduces a variable enzyme activity as a state, which acts as a variable maximum activity in the oxidase rate equation. Changes in activity depend on synthesis and “dilution by growth”. The synthesis rate \(v_{\mathrm{syn,Oxi}}\) is an algebraic equation: the first term represents basal expression, while the second term depends negatively on the transcription factor. Crucial for sensitive regulation is the FNR equation, which is a Hill-type algebraic equation with a large negative exponent, providing a switch-like, inhibitory response. This sensitivity is illustrated in the left panel below:
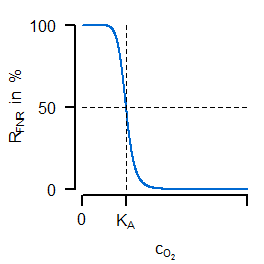
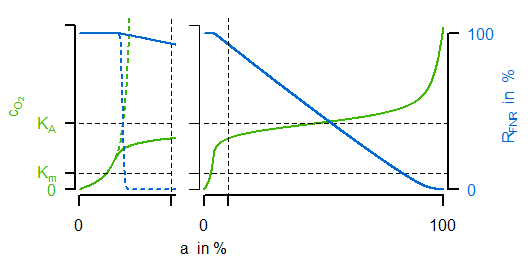
FNR activity decreases with increasing oxygen, with a switch-like transition around \(K_A\). The right panel compares simulations for the unregulated (dashed) and regulated (solid) cases. It shows how a nearly constant oxygen concentration (green curve, for suitable kinetic and regulatory parameter values) can be maintained despite different oxygen inflow rates.
The next question is whether ubiquinone concentration and ArcA activity can be explained analogously. For this, the following two regulatory variants (“M1” and “M2”) are analysed:
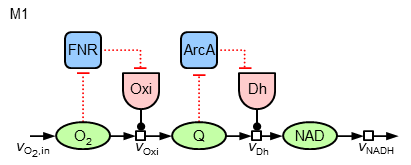
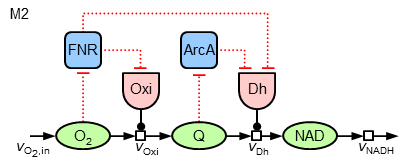
The equations are formulated analogously to the oxidase regulation. In M2, a “local” regulation of the dehydrogenase by ArcA is complemented by a feed-forward regulation via FNR (resulting in three additive terms in the synthesis equation).
Since estimating unknown parameter values from data is a key step in metabolic modelling, the next section introduces parameter identification using these two variants.
Parameter identification
In automatic parameter estimation, the parameter vector \(\underline{\theta}\) is chosen so that the parameter-dependent simulated trajectories \(\hat{y}_i\) match the measured values \(y_i\) as closely as possible. Simulation of ODE models is performed by numerically solving an initial value problem, using standard algorithms implemented in various software environments. The deviation between simulation and measurement is quantified by an objective (goodness-of-fit) function. Assuming normally distributed measurement noise with variances \(\sigma_i^2\), the following objective function can be used; parameter identification then amounts to minimising the sum of squared errors:
\[ \chi^2(\underline{\theta}) = \sum_{i=1}^{N} \frac{\left( y_i - \hat{y}_i(\underline{\theta}) \right)^2}{\sigma_i^2} \]Minimisation is performed iteratively using suitable nonlinear optimisation algorithms. The identified parameter values for both model variants are listed in the following table:
| $K_\mathrm{m,Oxi,O_2}$ | $K_\mathrm{m,Oxi,QH_2}$ | $K_\mathrm{m,Dh,Q}$ | $K_\mathrm{m,Dh,NAD}$ | $v_\mathrm{max,NADH}$ | $K_\mathrm{m,NADH}$ | $K_\mathrm{A,FNR,O_2}$ | $n_\mathrm{FNR}$ | $K_\mathrm{A,ArcA,Q}$ | $n_\mathrm{ArcA}$ | $p_\mathrm{syn,Oxi,min}$ | $p_\mathrm{syn,Oxi,FNR}$ | $p_\mathrm{syn,Dh,min}$ | $p_\mathrm{syn,Dh,ArcA}$ | $p_\mathrm{syn,Dh,FNR}$ | |
| $\mathrm{M1}$ | $4.51\mathrm{e}{-5}$ | $1\mathrm{e}{-5}$ | $4.06\mathrm{e}{-3}$ | $1.56\mathrm{e}{-3}$ | $11.91$ | $6.12$ | $3.63\mathrm{e}{-4}$ | $-10$ | $0.52$ | $-10$ | $0.68$ | $1.68$ | $7.97\mathrm{e}{-3}$ | $4.32$ | $\mathrm{---}$ |
| $\mathrm{M2}$ | $9.42\mathrm{e}{-5}$ | $0.05$ | $0.01$ | $0.01$ | $12.00$ | $2.5$ | $4.02\mathrm{e}{-4}$ | $-10$ | $0.50$ | $-9.98$ | $0.74$ | $4.50$ | $0.01$ | $0.75$ | $4.8$ |
Note the pronounced differences in the regulatory parameter values. In particular for dehydrogenase regulation, variant M1 (without FNR regulation) relies more strongly on ArcA, whereas in M2 FNR exerts the dominant influence on dehydrogenase regulation.
Systems biology analysis and interpretation
The following figure compares simulations of model variant M1 (with identified parameters) with experimental data:
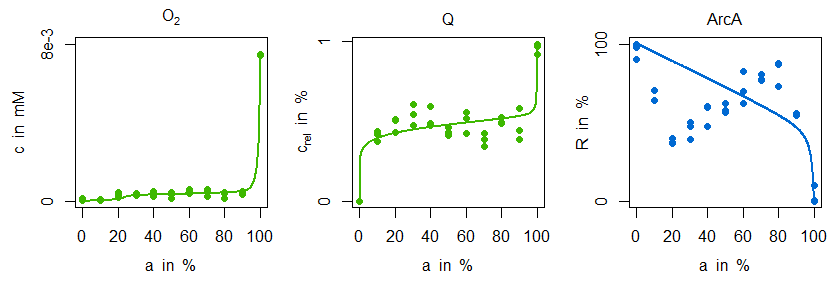
Sensitive regulation indeed leads to a reasonably good fit for ubiquinone, but it cannot reproduce the characteristic ArcA pattern. In contrast, the fitted model variant M2 captures not only the ArcA dynamics but also the subtle decrease of ubiquinone in the upper microaerobic range:
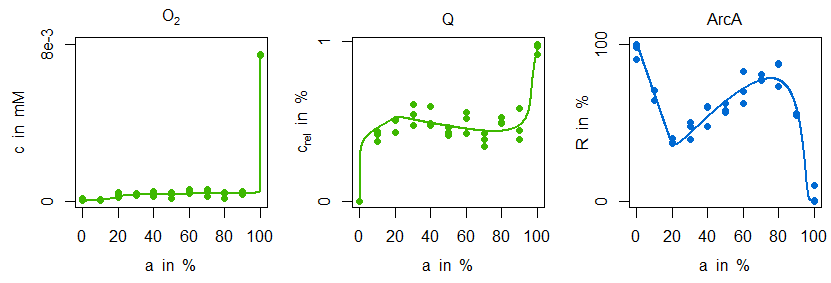
This behaviour is explained by the additional regulatory influence of FNR on dehydrogenase: information about increased oxygen availability disproportionately affects this enzyme’s activity, so that the slight decrease in ubiquinone at higher microaerobic levels leads to a rise in ArcA. Biologically, this has two advantages: ArcA enables more fine-grained regulation of other pathways and isoenzymes, and the regulatory motif has favourable properties under dynamic conditions, such as rapid fluctuations in oxygen availability.[1][7]
In the cited publication, these principles of ETC regulation were embedded and discussed within a more comprehensive model (including a phenomenological biomass model).
References
- [1] S. G. Henkel et al.: Basic regulatory principles of Escherichia coli's electron transport chain for varying oxygen conditions. In: PLoS ONE, 9(9):e107640, 2014. doi: 10.1371/journal.pone.0107640
- [2] A. Novick and L. Szilard: Experiments with the Chemostat on spontaneous mutations of bacteria. In: Proc. Natl. Acad. Sci. USA, 36(12):708–719, 1950. doi: 10.1073/pnas.36.12.708
- [3] A. Novick and L. Szilard: Description of the Chemostat. In: Science, 112:715–716, 1950. doi: 10.1126/science.112.2920.715
- [4] S. Alexeeva et al.: Effects of limited aeration and of the ArcAB system on intermediary pyruvate catabolism in Escherichia coli. In: J. Bacteriol., 182(17):4934–4940, 2000. doi: 10.1128/JB.182.17.4934-4940.2000
- [5] S. Alexeeva, K. J. Hellingwerf and M. J. Teixeira de Mattos: Quantitative assessment of oxygen availability: perceived aerobiosis and its effect on flux distribution in the respiratory chain of Escherichia coli. In: J. Bacteriol., 184(5):1402–1406, 2002. doi: 10.1128/JB.184.5.1402-1406.2002
- [6] S. Alexeeva, K. J. Hellingwerf and M. J. Teixeira de Mattos: Requirement of ArcA for redox regulation in Escherichia coli under microaerobic but not anaerobic or aerobic conditions. In: J. Bacteriol., 185(1):204–209, 2003. doi: 10.1128/JB.185.1.204-209.2003
- [7] S. Mangan and U. Alon: Structure and function of the feed-forward loop network motif. In: Proc. Natl. Acad. Sci. USA, 100(21):11980–11985, 2003. doi: 10.1073/pnas.2133841100