
Modern high-throughput technologies (omics) provide valuable insights into complex biological systems and diseases. However, the large volumes of raw data only turn into real findings once they are carefully preprocessed. We take over this critical preprocessing step for you – tailored to your scientific question and precisely aligned with your specific factors. This gives you a robust basis for all subsequent analyses.
(Status: November 2021)
Experimental design
Before any experiments are carried out, the experimental design must be carefully planned, as it has a major impact on preprocessing. It is essential to define the quantities of interest (e.g. expression of specific genes under specific conditions) and what needs to be measured in addition (e.g. expression of all genes or a set of housekeeping genes under the same conditions). You always need at least one measurement that remains unchanged throughout the experiment to serve as reference for preprocessing.
The number of samples to be taken and their distribution across experimental conditions is also crucial for feasibility and for the type of preprocessing that can be applied.
Experimental planning should therefore always be carried out jointly by the experimental scientists and the bioinformaticians/data analysts to ensure that all prerequisites for the necessary preprocessing steps (and for statistical evaluation) are met.
Microarrays and 2D gels
Microarrays are mainly used to determine differences in mRNA abundance between two differently treated cell populations. mRNA is converted into cDNA, which binds to immobilized DNA probes on the microarray and is detected via fluorescence.
An application example in which preprocessing and analysis of a specific microarray dataset are combined can be found HERE.
2D gels combine isoelectric focusing (IEF) with orthogonal SDS polyacrylamide gel electrophoresis (SDS-PAGE) to separate complex protein mixtures into individual proteins with high resolution. They are used, for example, to investigate differences in protein content between two cell populations. Although mass spectrometry-based methods account for a large share of today’s proteomics analyses, 2D gel electrophoresis still offers clear advantages for some questions.
Preprocessing and analysis of a 2D gel dataset as described below has been applied by BioControl in the past, in this case to DIGE gels with three color channels.
Image analysis
A characteristic feature of both 2D gels and microarrays is that the initial preprocessing steps are image based. If two or more samples are compared, the recorded images of the microarrays or gels must be aligned so that the same mRNAs or proteins can be compared across conditions. For microarrays this is relatively straightforward, because the probe positions are fixed. For 2D gels, many factors influence the exact migration pattern, which differs slightly every time.
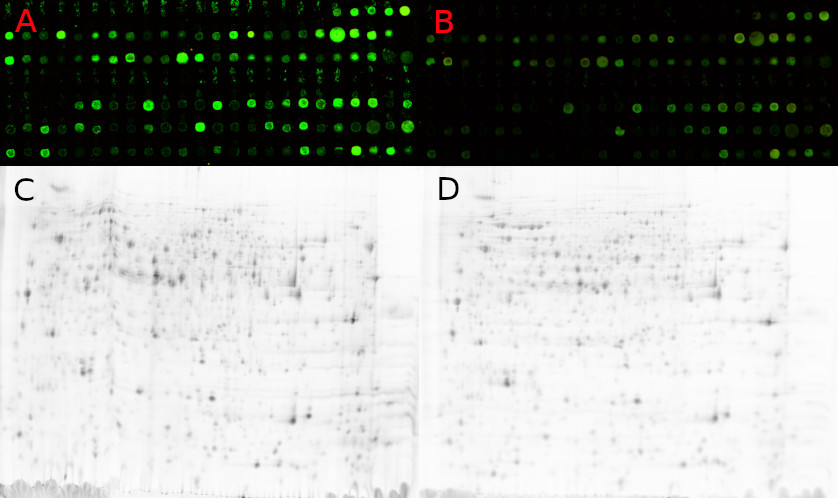
Matching of different images and spot detection is usually performed by the software delivered with the scanner. Correct settings for background normalization, artefact reduction and, in the case of 2D gels, separation of spot groups are crucial. For 2D gels, an (iterative) manual step is typically required to support automated alignment and avoid errors. Because commercial software is quite expensive, there are repeated efforts to achieve comparable performance with open-source tools.
Missing values
Problems in matching 2D gel images lead to missing values in the protein spot data. A protein may be present on both images but not correctly matched (e.g. due to distortions), resulting in missing values for certain conditions. Biological variability also leads to missing values (for both microarrays and 2D gels) when a gene or protein is expressed in one sample (visible as a spot) but not in another.
Because missing values complicate subsequent analyses and can prevent certain methods (e.g. clustering or PCA), they must be handled appropriately. If missing values are predominantly biologically caused (i.e. the gene/protein is not expressed or below detection limit in a condition), they can be replaced by a minimal value, for example the lowest measured value in the experiment, optionally with some noise added to reflect experimental variance. If, however, a technical issue is the cause of missing values, k‑nearest neighbour imputation has proven useful for 2D gel data.
Normalization
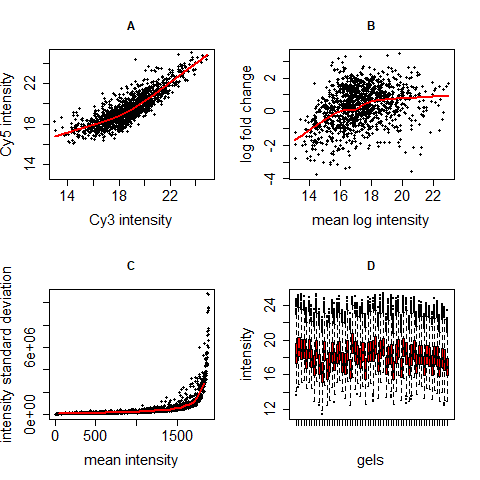
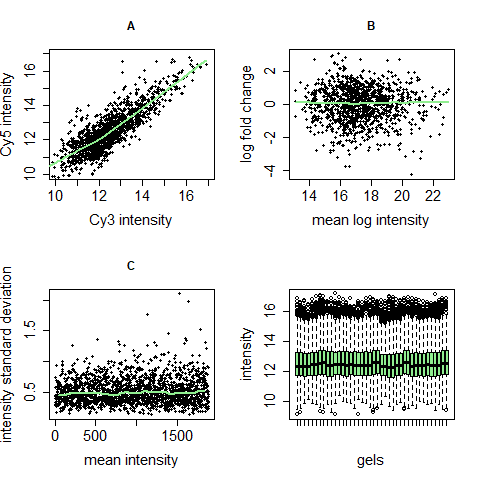
There are many approaches for normalizing microarray and 2D gel data. Since both technologies are spot based and share similar technical issues, many normalization algorithms can be applied to both. Here we describe one approach that specifically addresses four common issues of microarray and 2D gel raw data. It combines two steps: centering and variance stabilisation.
The underlying assumption for these normalization techniques is that only a relatively small subset of genes or proteins changes in expression or regulation, while the majority remains unchanged. This is usually the case when analysing entire genomes or proteomes. When only a subset of genes or proteins is considered, this assumption may be violated and another stable reference measure (e.g. total protein content per cell) is required.
Centering and variance stabilisation can address four typical problems in microarray and 2D gel data: dye effects (different dyes bind differently and one channel appears brighter, possibly only in certain intensity ranges), dependence of differential regulation on mean intensity, dependence of intensity variance on mean intensity, and differences in intensity distributions between gels/arrays.
Next-generation sequencing (NGS) and mass spectrometry (MS) data
In many applications, such as genome-wide gene expression analysis, NGS has largely replaced microarrays because it is faster, more cost-effective and more accurate. For similar reasons, MS-based methods are now widely used in proteomics.
Missing values
NGS datasets do not produce missing values in the strict sense but zero counts when no fragments are measured or assigned to a gene. Depending on how many values are zero, different strategies can be used. If, for example, in a triplicate only one value is missing (two values > 0, one zero), the two non-zero values are often sufficient. With only one non-zero value, the missing value can be estimated from that value and the local variance in the dataset. If all three values are zero, a value may be imputed using the lowest measured value and local variance.
In MS data, zero values often play a major role, especially when only parts of the proteome or metabolome are analysed. If there are only few missing values, they can be imputed with suitable minimal values in a way similar to NGS data. With a larger number of zeros, it may be necessary to exclude certain proteins or entire samples from the analysis. Excluded proteins can then be revisited using a targeted approach, focusing on their specific m/z regions in the spectrum.
Normalization
NGS data must be normalized for sequencing depth and gene length to compensate for differences in read counts per genomic region. RPKM, TPM or MRN values are commonly used for this purpose. This achieves centering of the data, analogous to microarray normalization. A second step of variance stabilisation is often handled by the error model used in downstream analysis; it is nonetheless essential, since NGS experiments typically show much higher variance at low intensities than at high ones.
MS data also require normalization to eliminate technical variation in sample preparation and measurement. It is crucial to know whether a whole-cell proteome is analysed or only a subset such as the secretome or a specific group of metabolites. Total proteome content cannot always be used as a normalization reference; in some cases, total sample volume may be more appropriate. If no suitable reference is available, it may not be possible to normalize, and raw data must be used instead. This again highlights the importance of close collaboration between experimental scientists and bioinformaticians at the planning stage: raw data then need to be of particularly high quality to allow meaningful statistical analysis.
References
- [1] K. Marcus, C. Lelong, T. Rabilloud: What room for two-dimensional gel-based proteomics in a shotgun proteomics world? In: Proteomes, 8(3):17, 2020. doi: 10.3390/proteomes8030017
- [2] D. Albrecht, R. Guthke, A. A. Brakhage, O. Kniemeyer: Integrative analysis of the heat shock response in Aspergillus fumigatus. In: BMC Genomics, 11:32, 2010. doi: 10.1186/1471-2164-11-32
- [3] D. Albrecht, O. Kniemeyer, A. A. Brakhage, R. Guthke: Missing values in gel-based proteomics. In: Proteomics, 10(6):1202–1211, 2010. doi: 10.1002/pmic.200800576
- [4] J. A. Molina-Mora, D. Chinchilla-Montero, C. Castro-Peña, F. García: Two-dimensional gel electrophoresis (2D-GE) image analysis based on CellProfiler: Pseudomonas aeruginosa AG1 as model. In: Medicine, 99(49):e23373, 2020. doi: 10.1097/MD.0000000000023373
- [5] D. Albrecht, O. Kniemeyer, A. A. Brakhage, R. Guthke: Normalisation of 2D DIGE data – On the way to a standard operating procedure. In: BIRD08, Schriftenreihe Informatik, 26:55–64, 2008.